
Keyword
Earth Science | Biological Classification | Protists | Plankton | Phytoplankton
107 record(s)
Type of resources
Topics
Keywords
Contact for the resource
Provided by
Formats
Update frequencies
Status
draft
-
This dataset contains data collected by the Australian Continuous Plankton Recorder (AusCPR) survey and is funded by IMOS (Ships of Opportunity sub-facility) and CSIRO. The aims of the AusCPR survey are to: * map plankton biodiversity and distribution * develop the first long-term plankton baseline for Australian waters * document plankton changes in response to climate change * provide indices for fisheries management * detect harmful algal blooms * validate satellite remote sensing * initialise and test ecosystem models. The survey conducts repeat tows in the GBR, the East Australian Current and down to the Southern Ocean Time Series Mooring (SOTS). Other routes are conducted on an adhoc nature around Australia. The dataset also contains phytoplankton data from the UTAS / AAD led Southern Ocean CPR (SOCPR) project which is also funded by IMOS. The datasets available in this collection include Phytoplankton Colour Index (an estimate of chlorophyll in the water), phytoplankton abundance, zooplankton abundance and a biomass index from AusCPR and phytoplankton abundance from SOCPR. This data are freely available through the AODN portal: https://portal.aodn.org.au. This data is freely available but please acknowledge all relevant parties, as detailed in acknowledgement section.
-
This dataset comprises the phytoplankton abundance and biovolume estimates as part of a broader sampling program carried out at the Southern Ocean Time Series, a facility within the Integrated Marine Observing System (IMOS). The primary focus is sustained observing of ocean properties and processes important to climate, carbon cycling, and ocean productivity. Regular phytoplankton samples are collected at approximately 14 day intervals (exact intervals and seasonal coverage dependent on deployment length). The moorings are serviced annually, at which time the existing moorings are recovered and new moorings are deployed. Water samples from within the surface mixed-layer are collected at pre-programmed intervals using a Remote Access Sampler, in pairs about 1 hour apart. One sample in each pair is preserved for phytoplankton community composition by microscopy, and the other sample is preserved and used for accompanying chemical analysis of nutrients, total dissolved inorganic carbon (DIC) and alkalinity. Each sample is collected from within the surface mixed-layer at 32 m depth (2010 - 2017) or 5 m depth (2018-current) depending on the design of the mooring surface assembly and instrumentation. Typically a maximum of 24 samples are collected over an annual deployment cycle. The samples collected are analysed for: 1. Community composition / abundance (cells/L) 2. calculated biovolume (um3/L). Protocols for the phytoplankton time-series are described in Eriksen et al (2018), and the annual sample reports for each deployment. Data storage and access is planned to be interoperable with other national and international programs through the IMOS Infrastructure. Station metadata can be found through this resource. Data is available freely via the AODN portal: https://portal.aodn.org.au. As the taxonomic resolution of the data has changed over time, due to continual training, it is important that users refer to the change log tables included in your data download. These will provide information on the validity of the taxa, from what date we have been identifying certain taxa etc. Classification fields may be blank depending on the level to which that taxa has been identified, i.e. if only identified to family, genus and species will be blank.
-
ESRI grids showing phytoplankton provinces around Australia. The information was supplied by Dr Gustaaf Hallegraeff, of the University of Tasmania in 2004 as an update of the Jeffrey/Hallegraeff 1991 phytoplankton map. Variations in onscreen colour representation or printed reproduction may affect perception of the contained data.
-
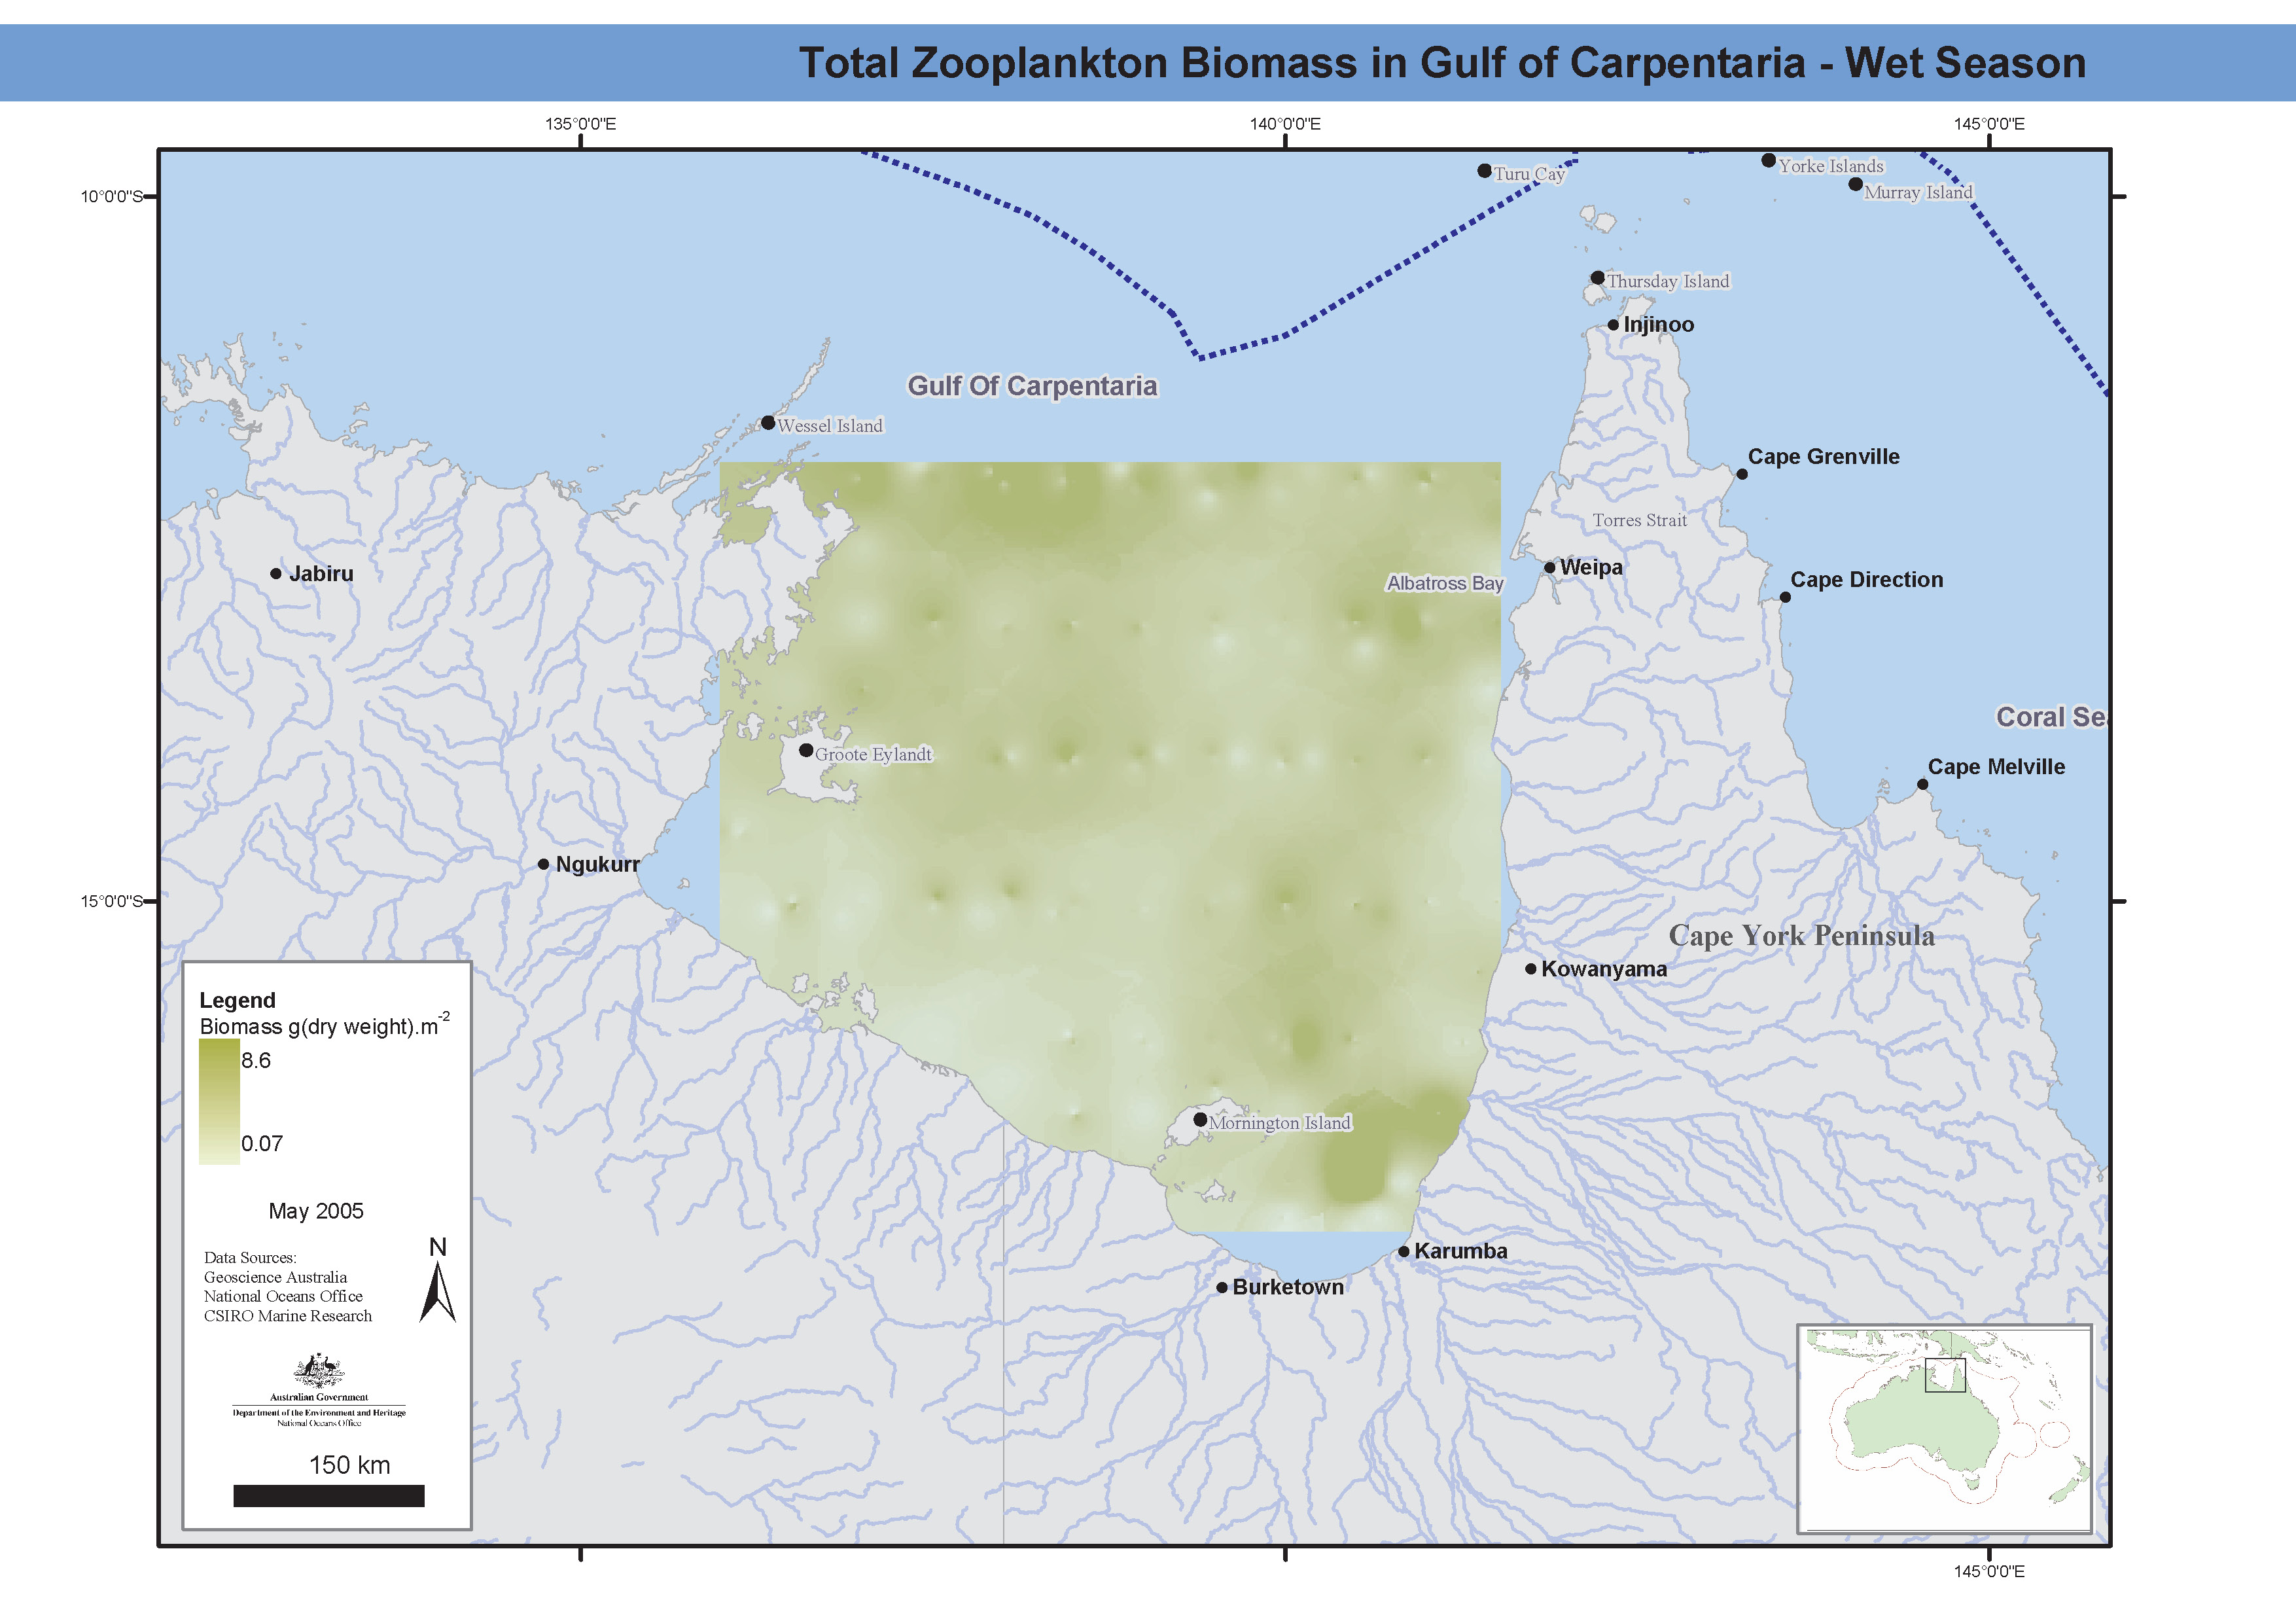
Maps of total zooplankton biomass (dry weight) from stepped oblique bottom to surface plankton tows from Albatross Bay. Biomass estimates from two mesh sizes. These maps have been produced by CSIRO for the National Oceans Office, as part of an ongoing commitment to natural resource planning and management through the 'National Marine Bioregionalisation' project.
-
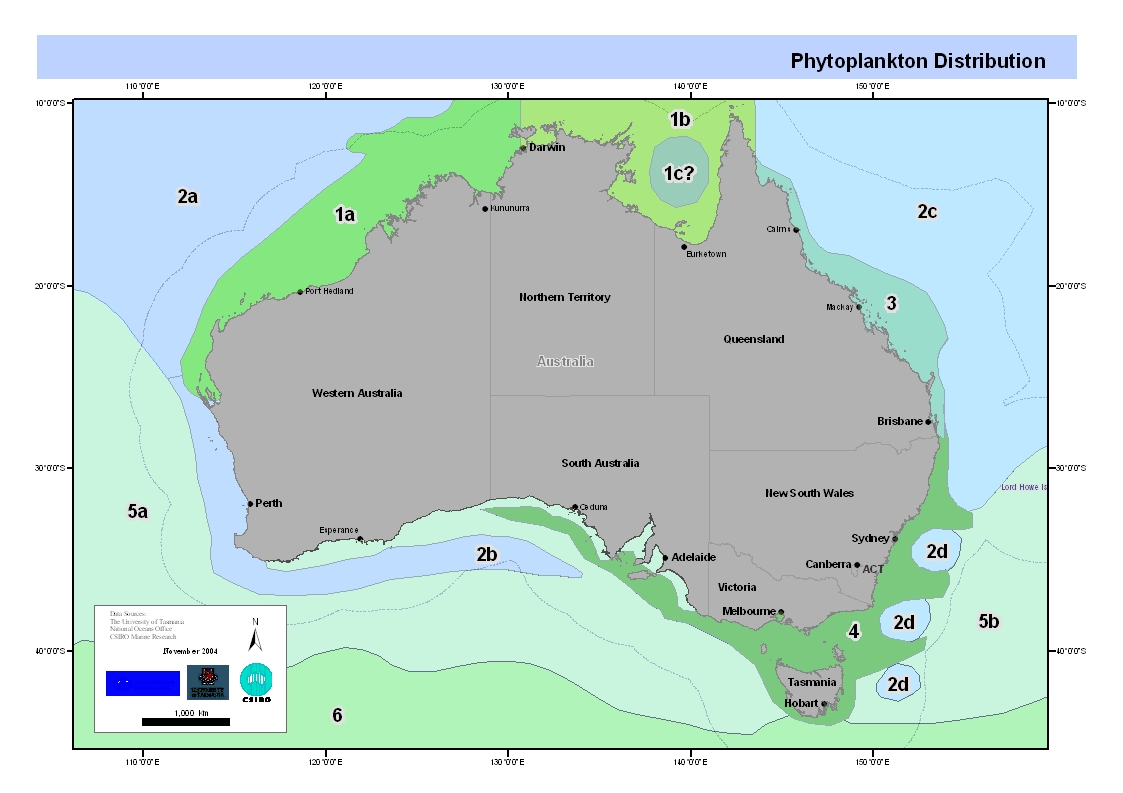
This dataset is a digitised version of an updated map of phytoplankton bioregions around Australia prepared by Dr Gustaaf Hallegraeff, of the University of Tasmania for the National Oceans Office, as part of the 'National Marine Bioregionalisation' project. It is an updated version of the map previously published Jeffrey & Hallegraeff in 1991 and is based on the original data which was collected by plankton nets and water bottle sampling, using light and electron microscopy for species identification, augmented by additional phytoplankton data collected in the period 1990-2004.
-
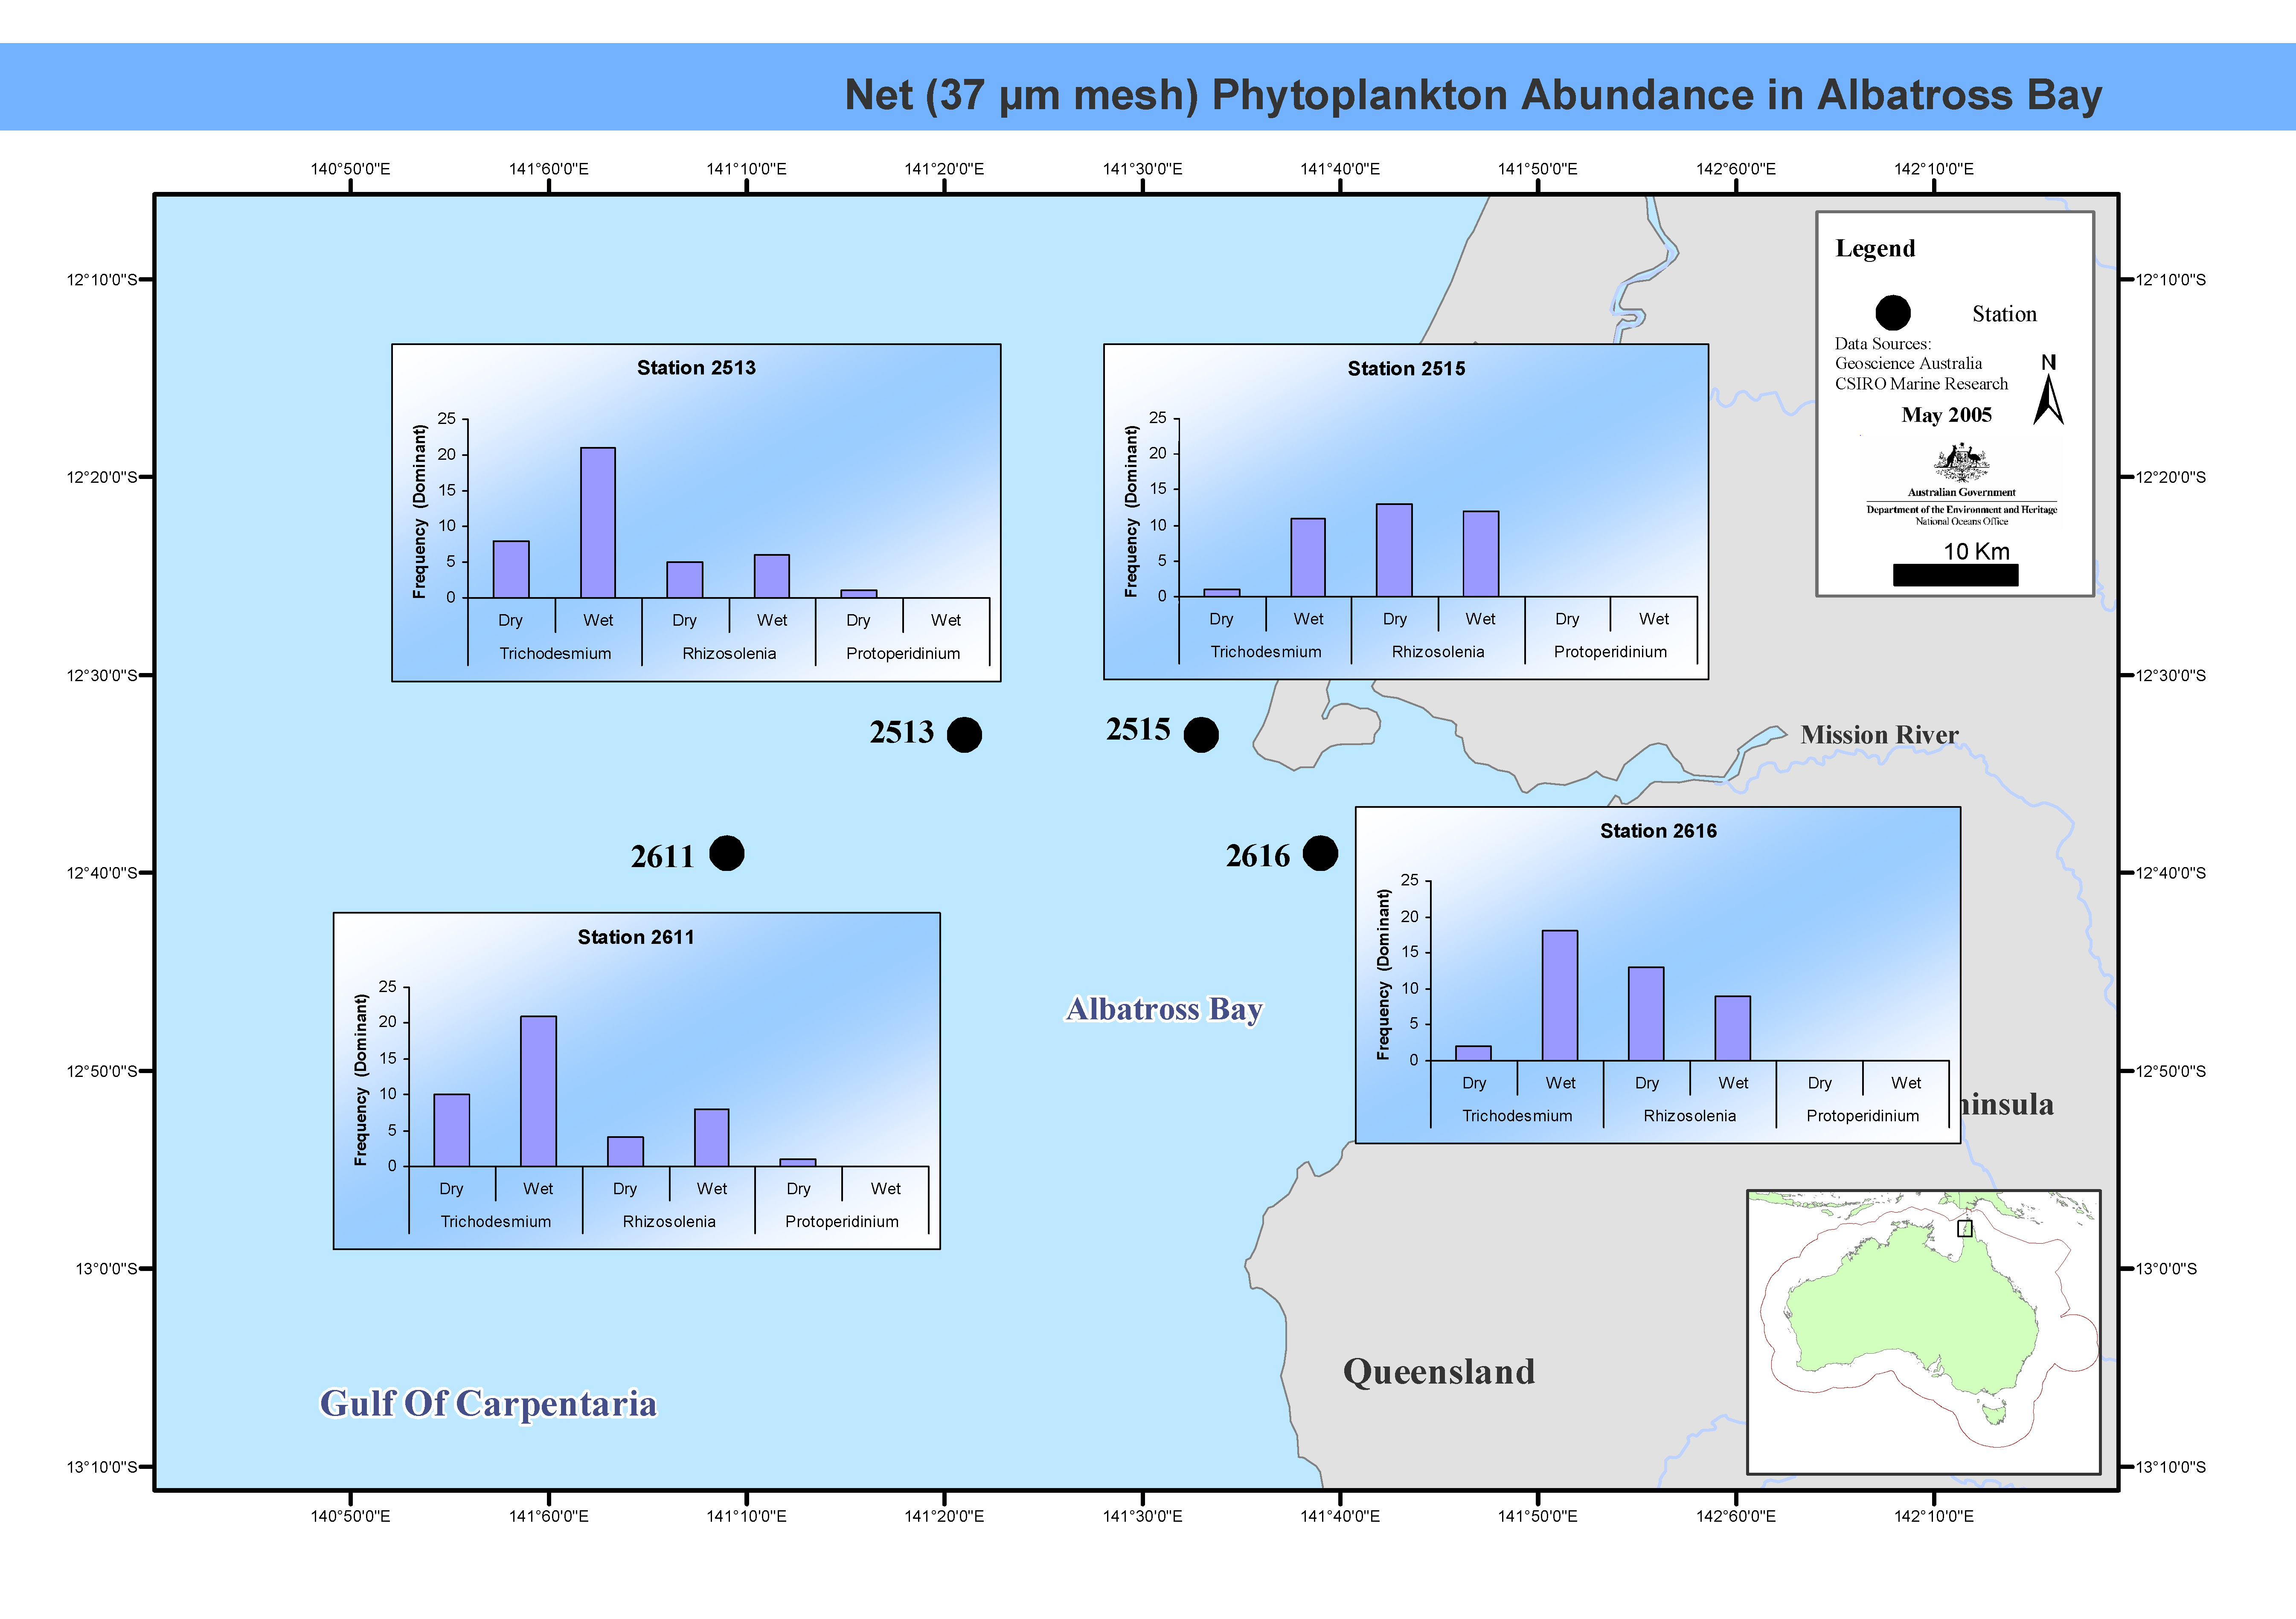
This map shows phytoplankton abundance in Albatross Bay. The biomass and species composition of tropical phytoplankton in Albatross Bay, Gulf of Carpentaria, northern Australia, were examined monthly for six years between March 1986 and April 1992. Phytoplankton taxonomic groups were identified to genus level, and described as dominant, common or rare. This map has been produced by CSIRO for the National Oceans Office, as part of an ongoing commitment to natural resource planning and management through the 'National Marine Bioregionalisation' project.
-
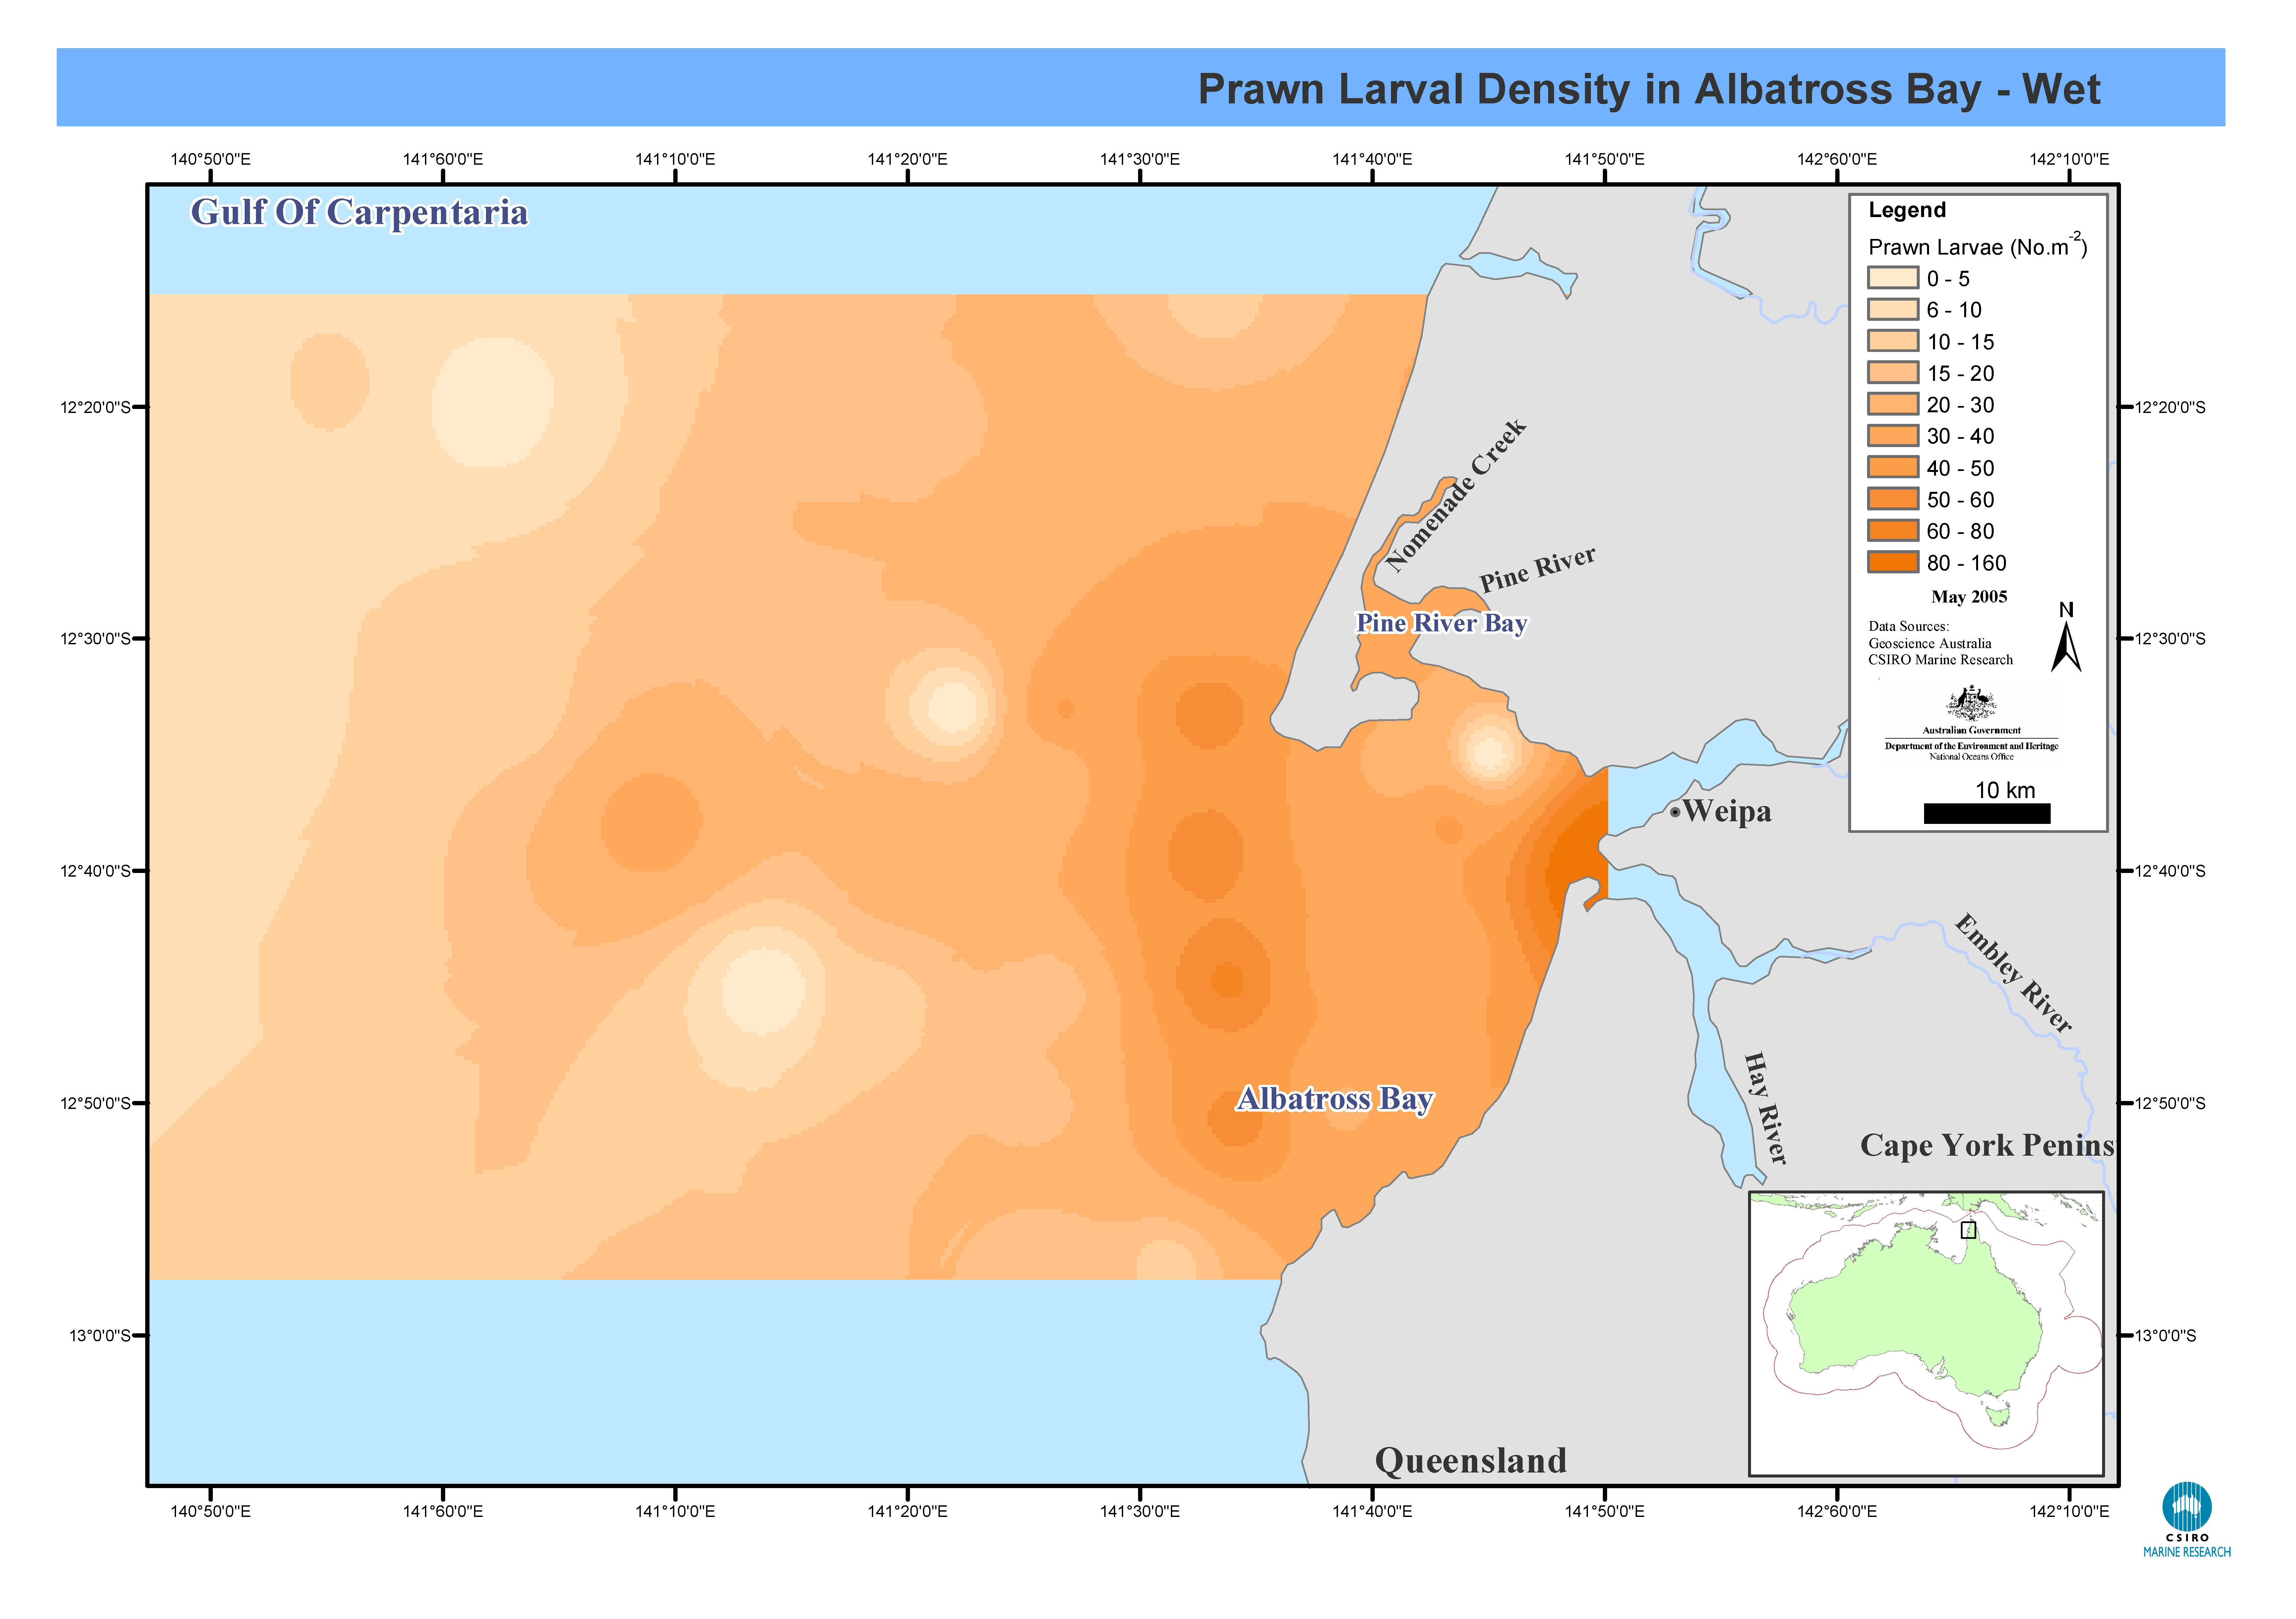
Maps showing prawn larval distribution in Albatross Bay, Gulf of Carpentaria, northern Australia for both the wet and dry seasons. Prawn larval density was recorded from stepped oblique bottom to surface plankton tows in Albatross Bay. Monthly cruises were carried out between March 1986 and April 1992, at twenty-one stations in Albatross Bay, Gulf of Carpentaria. Prawn larval densities were measured and salinity-temperature profiles taken. These maps have been produced by CSIRO for the National Oceans Office, as part of an ongoing commitment to natural resource planning and management through the 'National Marine Bioregionalisation' project.
-
Data showing chlorophyll a concentrations in Albatross Bay, Gulf of Carpentaria. Phytoplankton pigment composition (chlorophyll a concentration) was measured in Albatross Bay, Gulf of Carpentaria, northern Australia. Four sites were sampled over six years between August 1986 and April 1992. In the last two years samples were taken at the bottom of the water column in addition to mid-depth. This data has been produced by CSIRO for the National Oceans Office, as part of an ongoing commitment to natural resource planning and management through the 'National Marine Bioregionalisation' project.
-
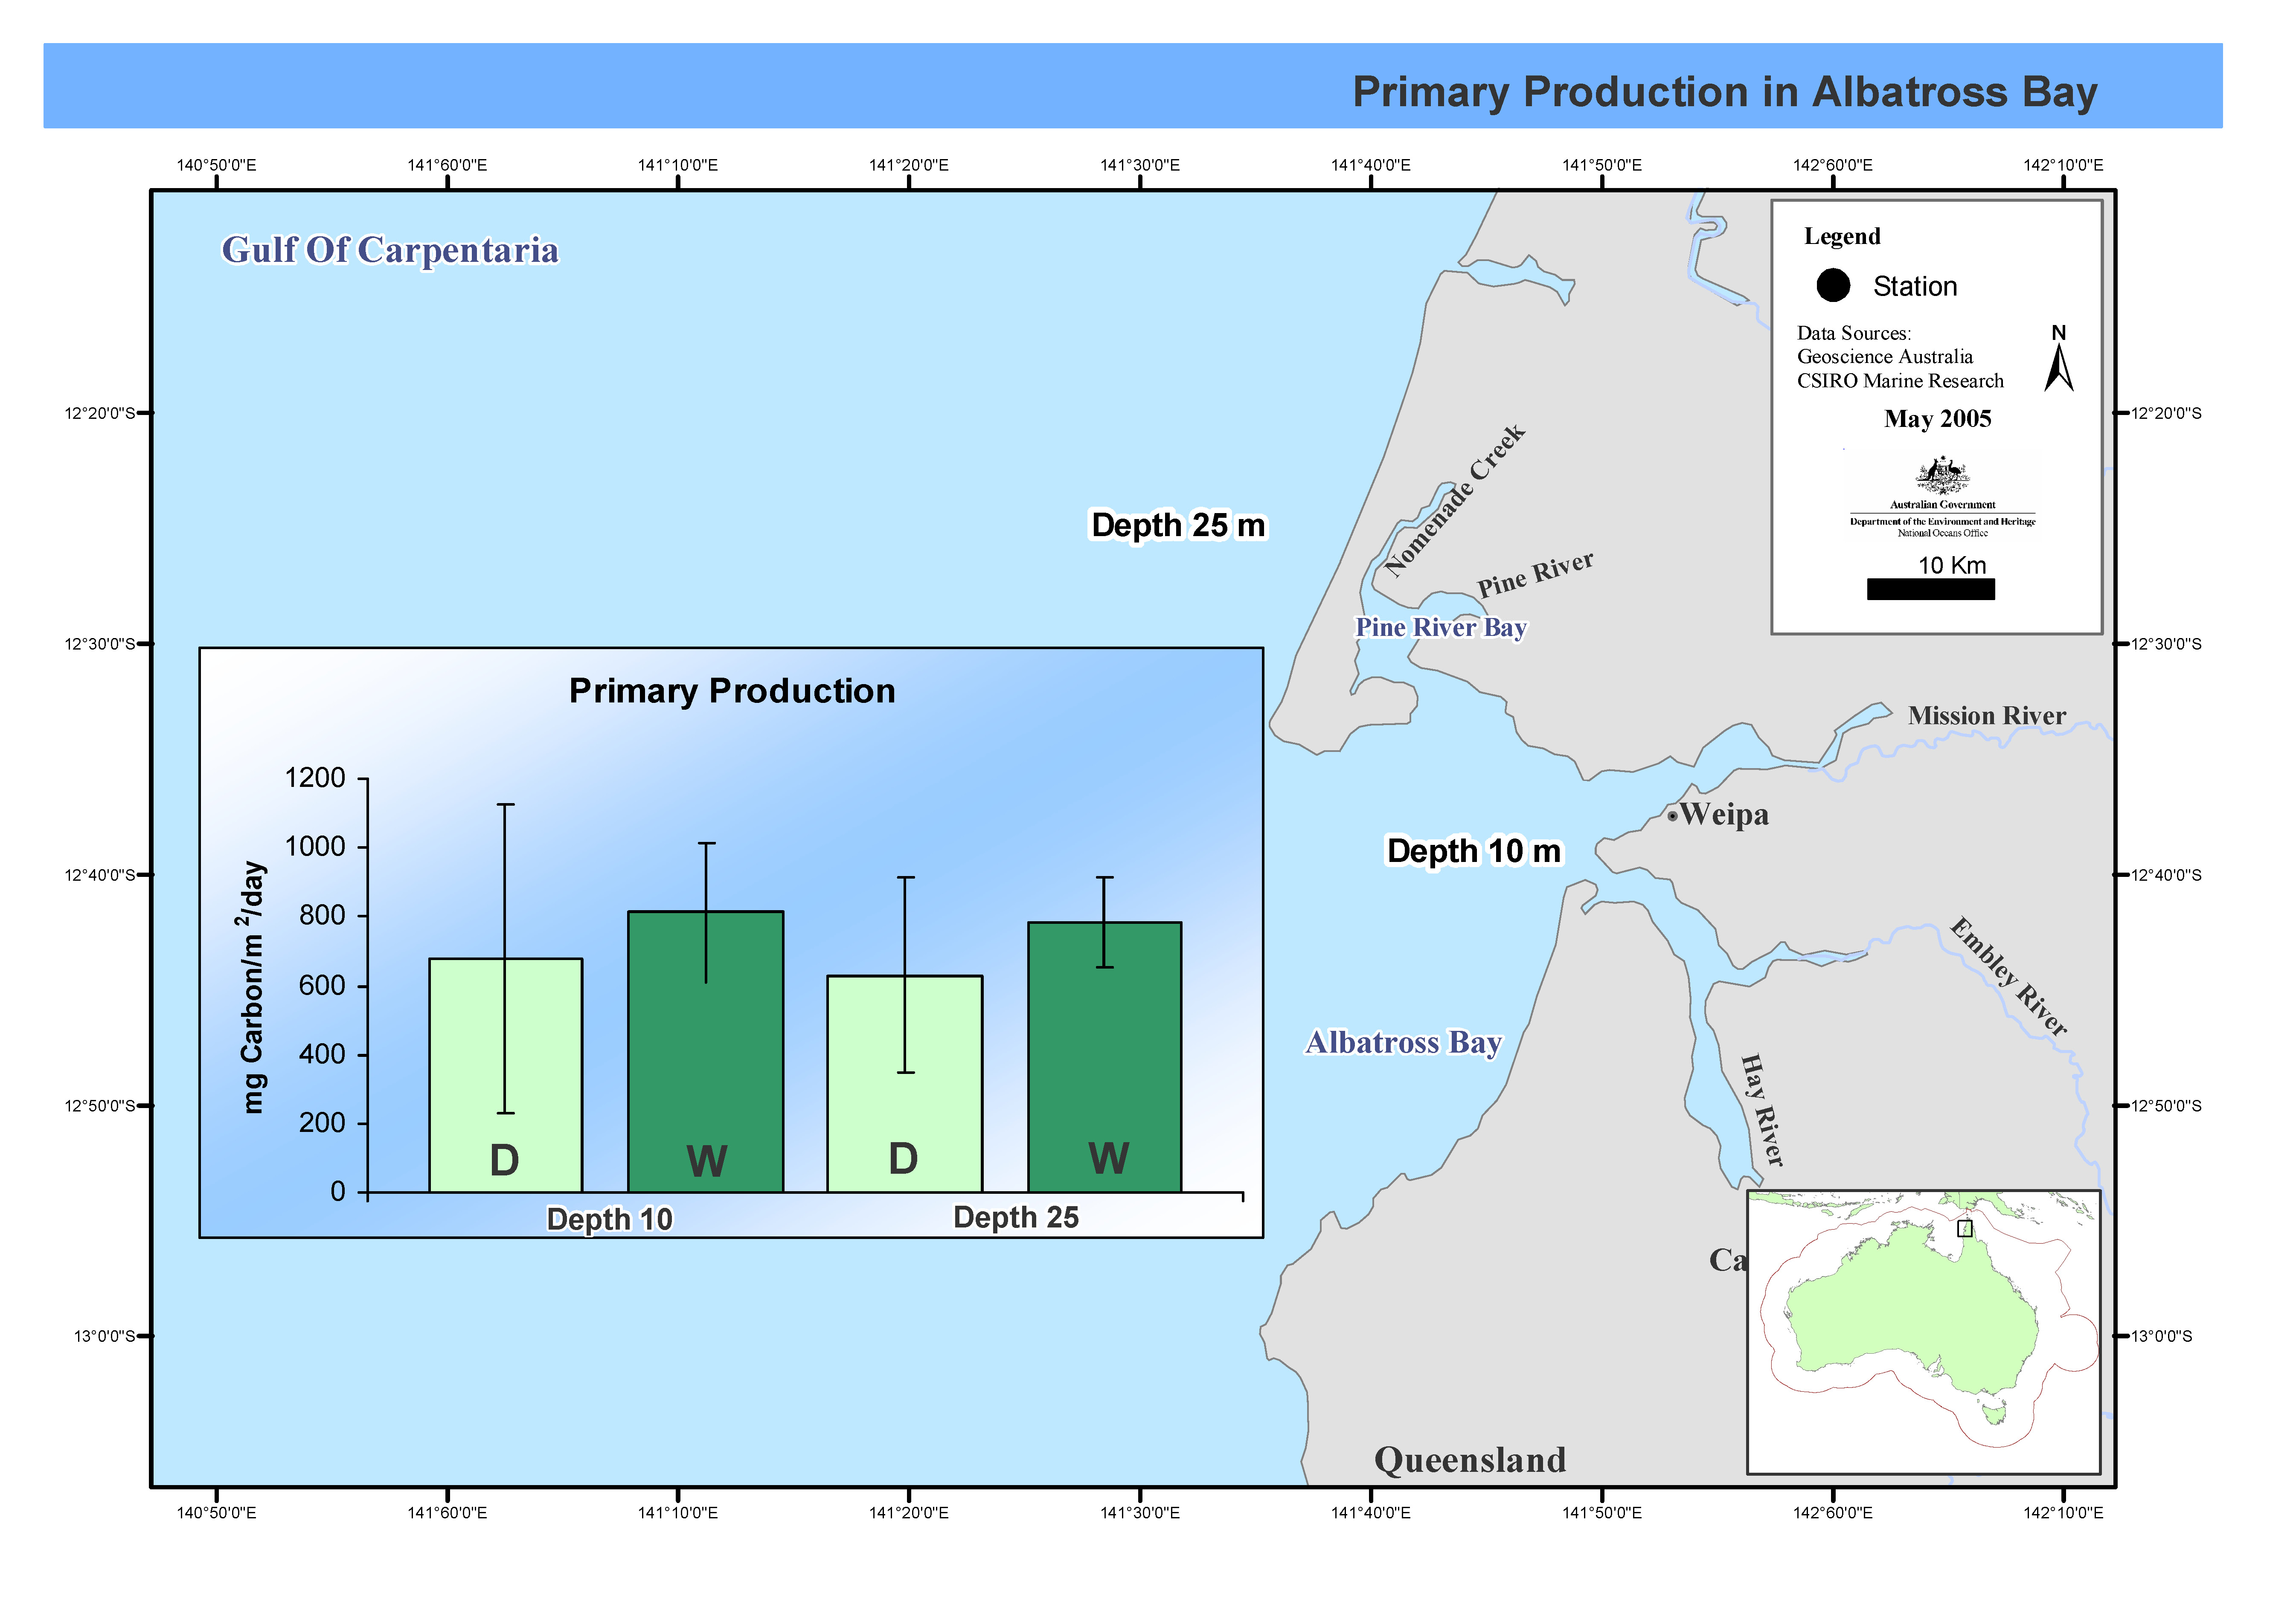
his map shows C14 primary productivity incubations at two stations over seven cruises in Albatross Bay during both the wet and dry seasons. Between February 1988 and February 1992 the FRV Jacqueline D completed nine cruises, seven in summer, two in winter, in Albatross Bay in the north-east Gulf of Carpentaria. Two stations, one 10m deep, the other at 25m, were sampled. Mean chlorophyll levels and primary productivity in the water column were measured. This map has been produced by CSIRO for the National Oceans Office, as part of an ongoing commitment to natural resource planning and management through the 'National Marine Bioregionalisation' project.
-
Data on primary productivity in the water column was collected during a 1988 cruise aboard the FRV "Franklin" in the Gulf of Carpentaria. Twenty stations were sampled.